Many Do the Math posts have touched on the inevitable cessation of growth and on the challenge we will face in developing a replacement energy infrastructure once our fossil fuel inheritance is spent. The focus has been on long-term physical constraints, and not on the messy details of our response in the short-term. But our reaction to a diminishing flow of fossil fuel energy in the short-term will determine whether we transition to a sustainable but technological existence or allow ourselves to collapse. One stumbling block in particular has me worried. I call it The Energy Trap.
In brief, the idea is that once we enter a decline phase in fossil fuel availability—first in petroleum—our growth-based economic system will struggle to cope with a contraction of its very lifeblood. Fuel prices will skyrocket, some individuals and exporting nations will react by hoarding, and energy scarcity will quickly become the new norm. The invisible hand of the market will slap us silly demanding a new energy infrastructure based on non-fossil solutions. But here’s the rub. The construction of that shiny new infrastructure requires not just money, but…energy. And that’s the very commodity in short supply. Will we really be willing to sacrifice additional energy in the short term—effectively steepening the decline—for a long-term energy plan? It’s a trap!
When I first encountered the concept of peak oil, I was most distressed about the economic implications. In part, this was prompted by David Goodstein’s book Out of Gas, which highlighted the potential for global panic in reaction to peak oil—making the gas lines associated with the temporary oil shocks of 1973 and 1979 look like warm-up acts. Because I knew Professor Goodstein personally, and held him in high regard as a solid physicist, I took his message seriously. Extrapolating his vision of a global reaction to peak oil, I imagined that the prospect of a decades-long decline in available energy—while we strained to institute a replacement infrastructure—would destroy confidence in short-term economic growth, thus destroying investment and crashing markets. The market relies on investor confidence—which, in some sense, makes it a con job, since “con” is short for confidence. If that confidence is shattered on a global scale, what happens next?
I still consider economic panic to be a distinctly possible eventuality, but psychology can be hard to predict. Market optimists would see the tremendous investment potential of a new energy infrastructure as an antidote against such an outbreak. Given this uncertainty, let’s shy away from economic prognostication and look at a purely physical dimension to the problem—namely, the Energy Trap.
Energy Return on Energy Invested
Our goal will be to quantitatively assess the Energy Trap, and see if there is any substance to the idea. We will rely on a concept that has acquired a central role in evaluating our energy future. This is energy return on energy invested, or EROEI.
In order to utilize energy, we must exert some energy to secure the source and prepare it for use. In order to burn wood in our fireplace, we (or someone) must chop down a tree, cut it into logs, and split the large logs. To drive our gasoline-powered car, we must expend energy finding the oil, drilling and possibly pumping the oil, then refining and distributing the gasoline. To collect solar energy, we must invest energy to fabricate the solar panels and associated electronics. The result is expressed as a ratio of energy-out:energy-in. Anything less than the break-even ratio of 1:1 means that the source provides no net energy (a drain, in fact), and is not worth pursuing for energy purposes—unless the form/convenience of that specific energy is otherwise unavailable.
In its early days, oil frequently yielded an EROEI in excess of 100:1, meaning that 1% or less of the energy contained in a barrel of oil had to be expended to deliver that barrel of oil. Not a bad bargain. Oil production today more typically has an EROEI around 20:1, while tar sands and oil shale tend to be about 5:1 and 3:1, respectively. By contrast, it is debatable whether corn ethanol exceeds break-even: it may optimistically be as high as 1.4:1. Switching from conventional oil to corn ethanol would be like switching from a diet of bacon, eggs, and butter to a desperate survival diet of shoe leather and tree bark. Other approaches to biofuels, like sugar cane ethanol, can have EROEI as high as 8:1.
To round out the introduction, coal typically has an EROEI around 50–85:1, and natural gas tends to come in around 20–40:1, though falling below the lower end of this range as the easy fields are depleted. Meanwhile, solar photovoltaics are estimated to require 3–4 years’ worth of energy output to fabricate, including the frames and associated electronics systems. Assuming a 30–40 year lifetime, this translates into an EROEI around 10:1. Wind is estimated to have EROEI around 20:1, and new nuclear installations are expected to come in at approximately 15:1. These are all positive net-energy approaches, which is the good news.
The Inevitable Fossil Fuel Decline
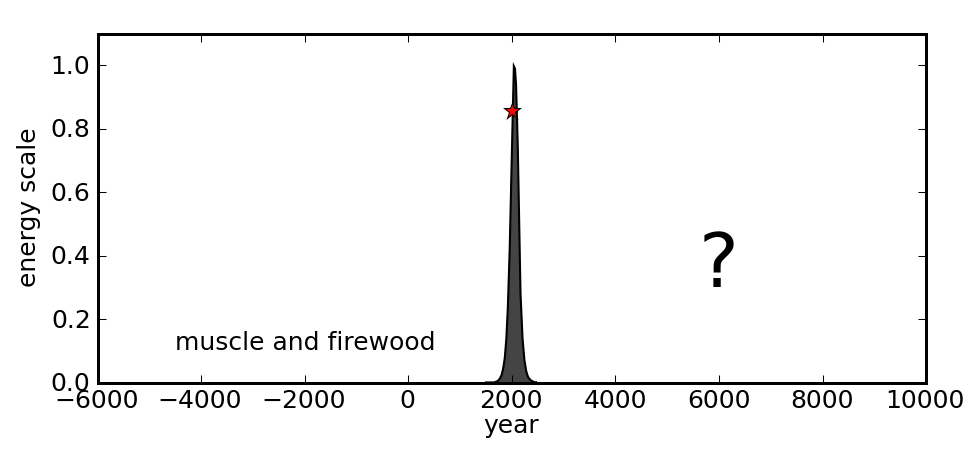
Let’s explore what happens as we try to compensate for an energy decline with an alternative resource having modest EROEI. On the upslope of our fossil fuel bonanza, we saw a characteristic annual growth rate of around 3% per year. The asymmetric Seneca Effect notwithstanding, a logistic evolution of the resource would result in a symmetric rate of contraction on the downslope: 3% per year. I borrow a graphic from the post on the meaning of “sustainable” to illustrate the rationale for expecting an era of decline for a one-time finite resource.
We could use any number for the decline rate in our analysis, but I’ll actually soften the effect to a 2% annual decline to illustrate that we run into problems even at a modest rate of decline. By itself, a 2% decline year after year—while sounding mild—would send our growth-based economy into a tailspin. As detailed in a previous post, across-the-board efficiency improvements cannot tread water against a rate as high as 2% per year. As we’ll see next, the Energy Trap just makes things worse.
Arresting the Decline: Take 1
Let’s say that our nation (or world) uses 100 units of fossil fuel energy one year, and expects to get only 98 units the following year. We need to come up with 2 units of replacement energy within a year’s time to fill the gap. If, for example, the replacement:
- has an EROEI of 10:1;
- requires most of the energy investment up front (solar panel or wind turbine manufacture, nuclear plant construction, etc.);
- and will last 40 years,
then we need an up-front energy investment amounting to 4 year’s worth of the new source’s output energy. Since we require an output of 2 units of energy to fill the gap, we will need 8 units of energy to bring the resource into use.
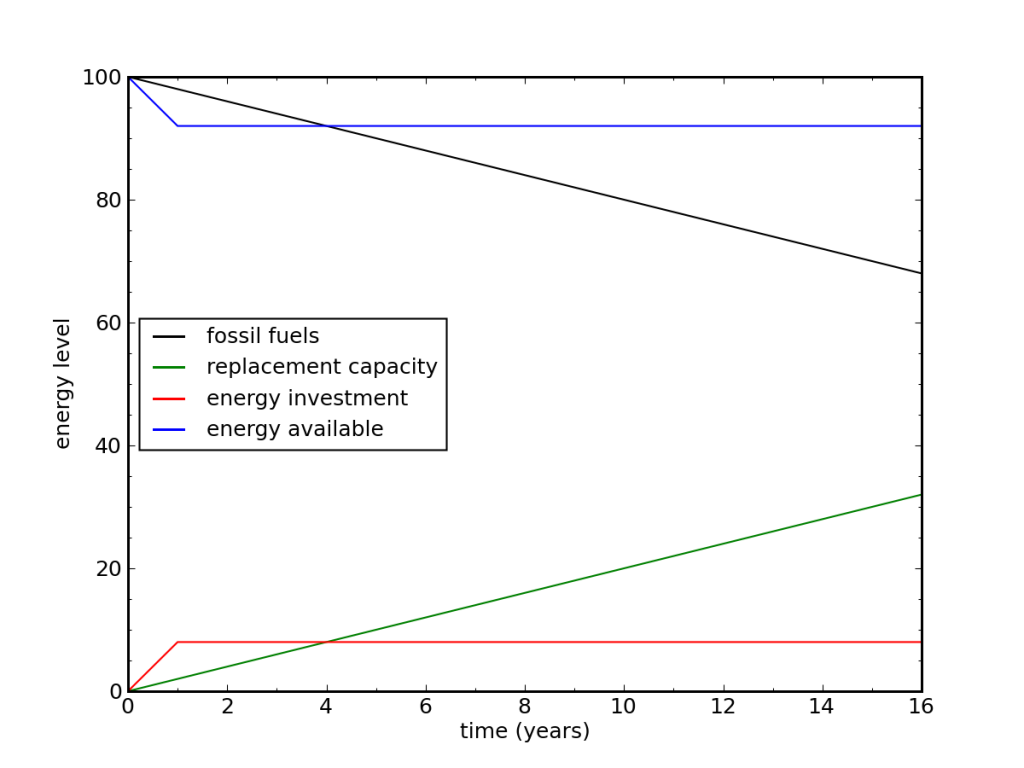
Of the 100 units of total energy resource in place in year one, only 92 are available for use—looking suddenly like an 8% decline. If we sit on our hands and do not launch a replacement infrastructure, we would have 98 units available for use next year. It’s still a decline, but a 2% decline is more palatable than an effective 8% decline. Since each subsequent year expects a similar fossil fuel decline, the game repeats. Where is the incentive to launch a new infrastructure? This is why I call it a trap. We need to exacerbate the sacrifice for a prolonged period in order to come out on top in the end.
The figure above shows what this looks like graphically, given a linear fossil fuel decline of 2 units per year. The deployment steps up immediately to plug the gap by providing an additional 2 units of replacement each year, at an annual cost of 8 units. While the combination of fossil fuels and replacement resource always adds to 100 units in this scheme, the ongoing up-front cost of new infrastructure produces a constant drain on the system. In terms of accumulated energy lost, it takes 7 years before the energy sacrifice associated with replacement starts to be less than that of just following the fossil fuel slide with no attempt at replacement. This timescale is beyond the typical horizon of elected politicians.
Another aspect of the trap is that we cannot build our way out of the problem. If we tried to outsmart the trap by building an 8-unit replacement in year one, it would require 32 units to produce and only dig a deeper hole. The essential point is that up-front infrastructure energy costs mean that one step forward results in four steps back, given EROEI around 10:1 and up-front investment for a 40 year lifetime. Nature does not provide an energy financing scheme. You can’t build a windmill on promised energy.
We can mess with the numbers to get different results. If only half the total energy invested is up-front, and the rest is distributed across the life of the resource (mining and enriching uranium, for instance), then we take a 4% hit instead of 8%. Likewise, a 40-year windmill at 20:1 EROEI and full up-front investment will require 2 years of its 2-unit gap-filling contribution to install, amounting to an energy cost of 4 units and therefore a 4% hit. It’s still bigger than the do-nothing 2%, which, remember, is already a source of pain. Anyone want to double the pain? Anyone? Elect me, and that’s what we’ll do. Any takers? No? Wimps.
Ramp It Up!
It is unrealistic to imagine that we could jump into a full-scale infrastructure replacement in one year. To set the scale, the U.S. uses about 3 TW of continuous power. A 1% drop corresponds to 30 GW of power. Our modest 2% replacement therefore would require the construction of about 60 new 1 GW power plants in a single year, or a rate of one per week! Worldwide, we quadruple this number.
What capability have we demonstrated in the past? In 2010, global production of solar photovoltaics was 15 GW, which is only about 6% of what we would need to fill a world-wide energy gap of 2% per year. Even on a tear of 50% increase per year, it would take 7 years to get to the required rate. Wind installations in 2010 totaled 37 GW, or 14% of the 2% global requirement. It would take 5 years at a breakneck 50% per year rate of increase to get there. When France decided to go big on nuclear, they built 56 reactors in 15 years. In doing so, they replaced 80% of their electricity consumption, which translates to about 30% of their total energy use. So this puts them at about 2% per year in energy replacement.
I am being cavalier about comparing the thermal energy in fossil fuels to electricity delivered (factor of 3 in heat engine), but I more-than-compensate by not incorporating the large intermittency factor for wind and solar (factor of 4–5). For nuclear, expressing the replacement in terms of displaced fossil fuel makes for fair play. But in the end, this point only addresses realistic rates of infrastructure addition, and does not bear on the general Energy Trap phenomenon.
Arresting the Decline: Take 2
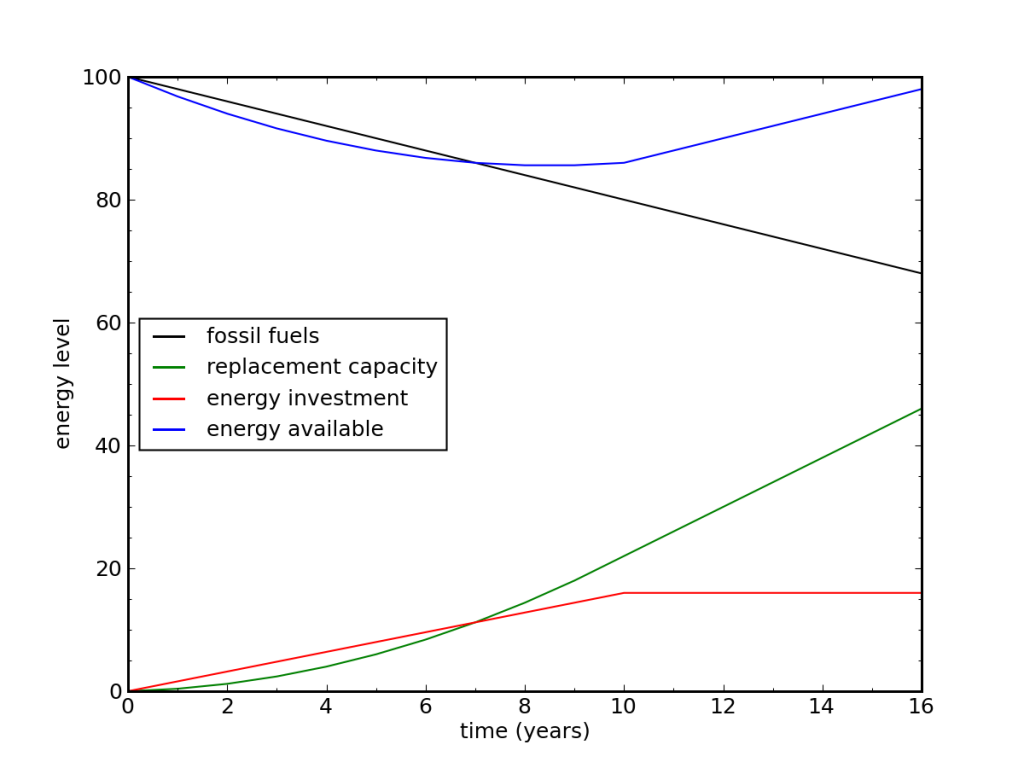
Let’s imagine a more realistic trajectory for the replacement effort. In our scenario, the world faces a huge crisis, so we could perhaps outperform France’s impressive nuclear push and ultimately replace energy infrastructure at a rate of 4% per year. But it takes time to get there. If it takes 10 years to ramp up to full speed, we have the situation seen in the following graph.
The energy investment still forces us to steepen the decline, initially looking like a 3.2% rather than a 2% decline. But it’s not as jarring as a sudden 8% drop. On the other hand, we fall farther before pulling out, bottoming out at >14% total drop around years 8–9. It takes more than 10 years to make out better than the do-nothing approach in terms of net energy loss. A table corresponding to the plot appears below for those interested in poring over the numbers to figure out how this game is played.
| year | fossil fuels | add | total | invest | avail. | FF loss | net loss |
| 0 | 100 | 0 | 0 | 0 | 100 | 0 | 0 |
| 1 | 98 | 0.4 | 0.4 | 1.6 | 96.8 | 2 | 3.2 |
| 2 | 96 | 0.8 | 1.2 | 3.2 | 94.0 | 6 | 9.2 |
| 3 | 94 | 1.2 | 2.4 | 4.8 | 91.6 | 12 | 17.6 |
| 4 | 92 | 1.6 | 4.0 | 6.4 | 89.6 | 20 | 28.0 |
| 5 | 90 | 2.0 | 6.0 | 8.0 | 88.0 | 30 | 40.0 |
| 6 | 88 | 2.4 | 8.4 | 9.6 | 86.8 | 42 | 53.2 |
| 7 | 86 | 2.8 | 11.2 | 11.2 | 86.0 | 56 | 67.2 |
| 8 | 84 | 3.2 | 14.4 | 12.8 | 85.6 | 72 | 81.6 |
| 9 | 82 | 3.6 | 18.0 | 14.4 | 85.6 | 90 | 96.0 |
| 10 | 80 | 4.0 | 22.0 | 16.0 | 86.0 | 110 | 110 |
| 11 | 78 | 4.0 | 26.0 | 16.0 | 88.0 | 132 | 122 |
| 12 | 76 | 4.0 | 30.0 | 16.0 | 90.0 | 156 | 132 |
Note that anywhere along the path, a cessation of the replacement effort will bring instant relief. For example, at the beginning of year 6, having installed 6 units of replacement energy up to that point, abandoning the effort will see 88 units of fossil fuel plus the 6 units of replacement for a total of 94 units. This would be a considerable step up from the previous year’s 88 units of available energy, and an even larger apparent gain over the 86.8 units that would be available under a continuation of the crash program. Likewise, if one stopped the program at the end of ten years, the installed 22 units of replacement would complement the eleventh-year fossil fuel amount of 78 units to bring us back to a peachy 100 units—like nothing had ever happened, and far better than the 88 units that we would otherwise endure under a continuation of the program. But stopping renews the dangerous decline. The point is that there will always be a strong temptation to end the short-term pain for immediate relief.
General Behaviors
As mentioned before, the Energy Trap is a generic consequence of modest-EROEI sources requiring substantial up-front investment in energy. We would need the EROEI to be equal to the resource lifetime in order to have a null effect during the decline years, or better than this to ease the pain or allow growth. For a 40 year lifetime (e.g., power plant, solar panels, wind turbines), this means we would need 40:1 EROEI or better to avoid the trap. Our alternatives simply don’t measure up. Curses!
For resources that do not require substantial up-front cost in the form of infrastructure, the trap does not apply. Fossil fuels tend to be of this sort. The energy required to deliver a barrel of oil or a ton of coal tends to be specific to the delivered unit, and is not dominated by up-front cost. It is similar for tar sands, which requires substantial energy to heat and process the sludge. Even at 5:1 EROEI, filling a 2-unit gap can be achieved by producing 2.5 units of output while losing 0.5 units to investment. Thus it is possible to maintain a steady energy supply. The fact that fossil fuels don’t trap us encourages us to stick with them. But being a finite resource, their attractiveness is the sound of the Siren, luring us to stay on the sinking ship. Or did the Sirens lure sailors from ships? Either way, fossil fuels are already compatible with our transportation fleet, strengthening the death-grip.
Conversely, solar photovoltaics, solar thermal, wind, and nuclear, are all ways to make electricity, but these do not help us very much as a direct replacement of the first-to-fail fossil fuel: oil. This is a very serious point. As Bob Hirsch pointed out in the 2005 report commissioned by the Department of Energy, we face a liquid fuels problem in peak oil. As such, not one of the five immediately actionable crash-program mitigation strategies outlined in the report represented a departure from finite fossil fuels. The grip is tight, indeed.
We must therefore compound the Energy Trap problem if we want to replace oil with any of the renewable sources listed above, because we need to add the energy investment associated with manufacturing a new fleet of electric vehicles of one form or another (plug-in hybrid qualifies). This can’t happen overnight, and will result in a prolonged transportation energy shortfall even greater in magnitude than depicted above.
Do We Have What it Takes?
Many of us have great hopes for our energy future that involve a transition to a gleaming renewable energy infrastructure, but we need to realize that we face a serious bottleneck in its implementation. The up-front energy investment in renewable energy infrastructures has not been visible as a hurdle thus far, as we have had surplus energy to invest (and smartly, at that; if only we had started in earnest earlier!). Against a backdrop of energy decline—which I feel will be the only motivator strong enough to make us serious about a replacement path—we may find ourselves paralyzed by the Trap.
In the parallel world of economics, an energy decline likely spells deep recession. The substantial financial investment needed to carry out an energy replacement crash program will be hard to scrape together in tough times, especially given that we are unlikely to converge on the “right” solution into which we sink our bucks.
Politically, the Energy Trap is a killer. In my lifetime, I have not witnessed in our political system the adult behavior that would be needed to buckle down for a long-term goal involving short-term sacrifice. Or at least any brief bouts of such maturity have not been politically rewarded. I’m not blaming the politicians. We all scream for ice cream. Politicians simply cater to our demands. We tend to vote for the candidate who promises a bigger, better tomorrow—even if such a path is untenable.
The only way out of the political trap is for a substantial fraction of our population to understand the dimensions of the problem: to understand that we’ve been spoiled by the surplus energy available through fossil fuels, and that we will have to make decade-level sacrifices to put ourselves on a new track. The only way to accomplish this is through sober education, which is what Do the Math is all about. It’s a trap! Spread the word!
Tom Murphy: Growth has an Expiration Date
https://www.youtube.com/watch?v=o_8b6ej0U3g
Energy and Human Ambitions on a Finite Planet
Author
Tom Murphy is a professor of physics at the University of California, San Diego. An amateur astronomer in high school, physics major at Georgia Tech, and PhD student in physics at Caltech, Murphy has spent decades reveling in the study of astrophysics.
![]() Don't forget to feed the birds. Donate here
Don't forget to feed the birds. Donate here


